Use and Navigation
This page includes basic navigation elements within the Risk Tool.
Basic Navigation
Once you sign on, you should be able to see the system dashboard, as shown in Figure 5.
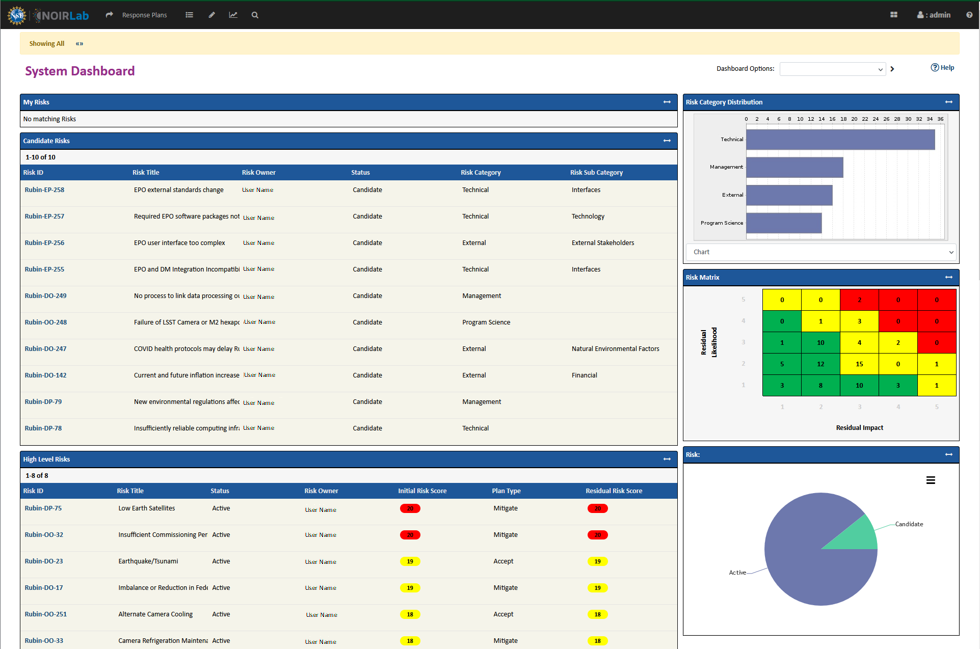
Figure 5 Example of system dashboard.
The Risk Tool is used for multiple projects at NOIRLab — you can limit the information shown by selecting Rubin Operations.
Note
Your access to risks, reports, etc. is limited to only your project/program/service and you will also have read-only access to NOIRLab directorate risks.
If you need to acquire access to any other risk register, contact NOIRLab system administrators.
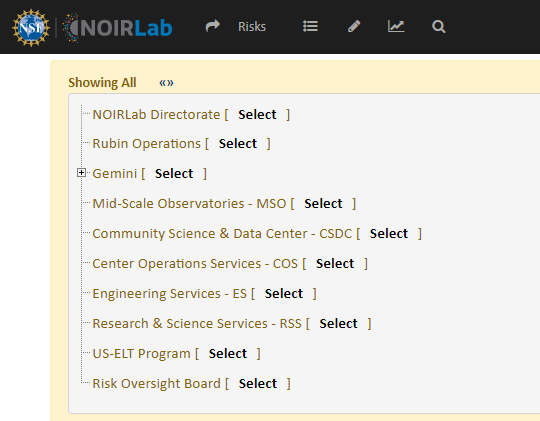
Figure 6 List of projects that use the Risk Tool.
The Risk Tool is comprised of three tracks which are associated with managing the risks — risks, responses and actions.
Users navigate through each track independently by either viewing the system dashboard (set up by administrators) or a personal main menu for each track (configured by your profile settings).
Additionally, there is a personal dashboard.
Figure 7 describes basic navigation within the webapp, where the menu buttons are applied to the active track.
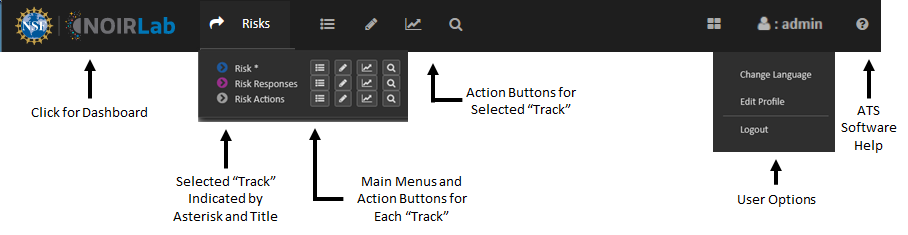
Figure 7 Description of main header bar navigation.
Button |
Description |
|---|---|

|
List Risks/Responses/Actions. |

|
Create new Risk/Responses/Actions. |

|
Create or generate reports of Risks/Response Plans/Actions. |

|
Create or apply filters to Risks/Responses/Actions. |
Figure 8 is an example of a main menu, specifically the “Risk” track.
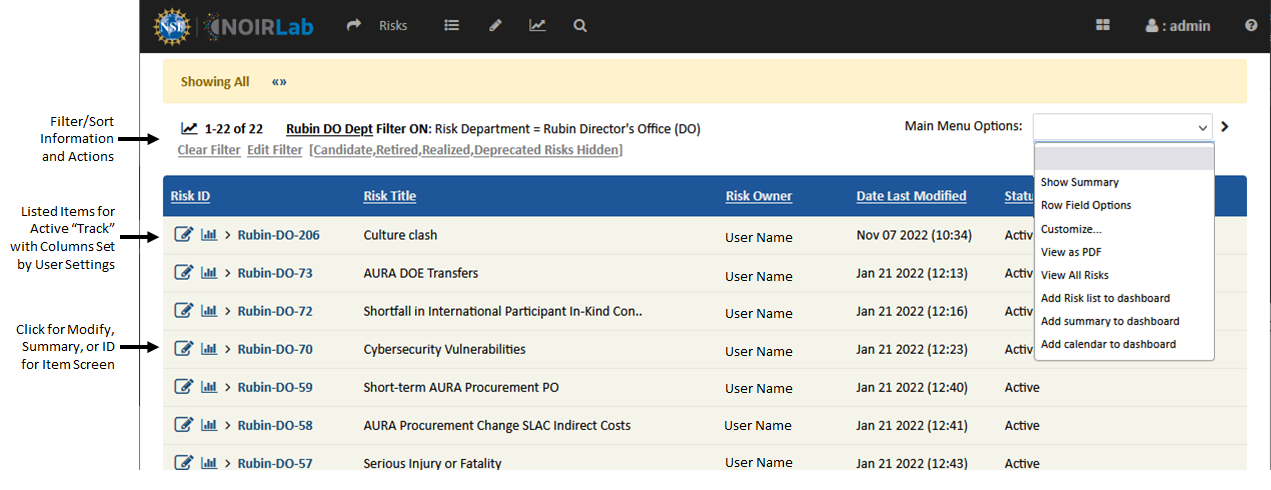
Figure 8 Example of main menu, specifically for the “Risk” track.
There are separate main menus for each track:
- Risks
A risk can be categorized as an
opportunityor athreat.The Project Management Institute (PMI) defines a risk in the Project Management Body of Knowledge (PMBOK) Guide <https://www.pmi.org/pmbok-guide-standards/foundational/pmbok>® as an “uncertain event or condition that, if it occurs, has a positive or negative effect on a project’s objectives.”
- Responses
Responses are strategic process(es) controlling identified risks, whereby the stakeholders decide how to deal with each risk be it opportunities or threats.
- Actions
Actions are reactions to a realized risk.
Filters and Reports
Within the Risk Tool, filters and reports are different features. Filters and sorting can be utilized for a track’s main menu, displaying group(s) of sorted rows, showing a customized list of field headers. Reports are generated lists, summaries, matrices and charts to capture a snapshot or trending information of sorted and/or filtered items within a track.
This user guide will not go into depth about setting up filters or reports; however, a few basic examples are provided.
Filters
Filters and sorting can be utilized for a track’s main menu, displaying group(s) of sorted rows, showing a customized list of field headers.
There are system filters (set up by administrators) and user filters.
Figure 9 is an example of the Filter menu available from the main header bar. Clicking the modify button on a system filter allows a user to start creating a user filter starting from the same criteria.
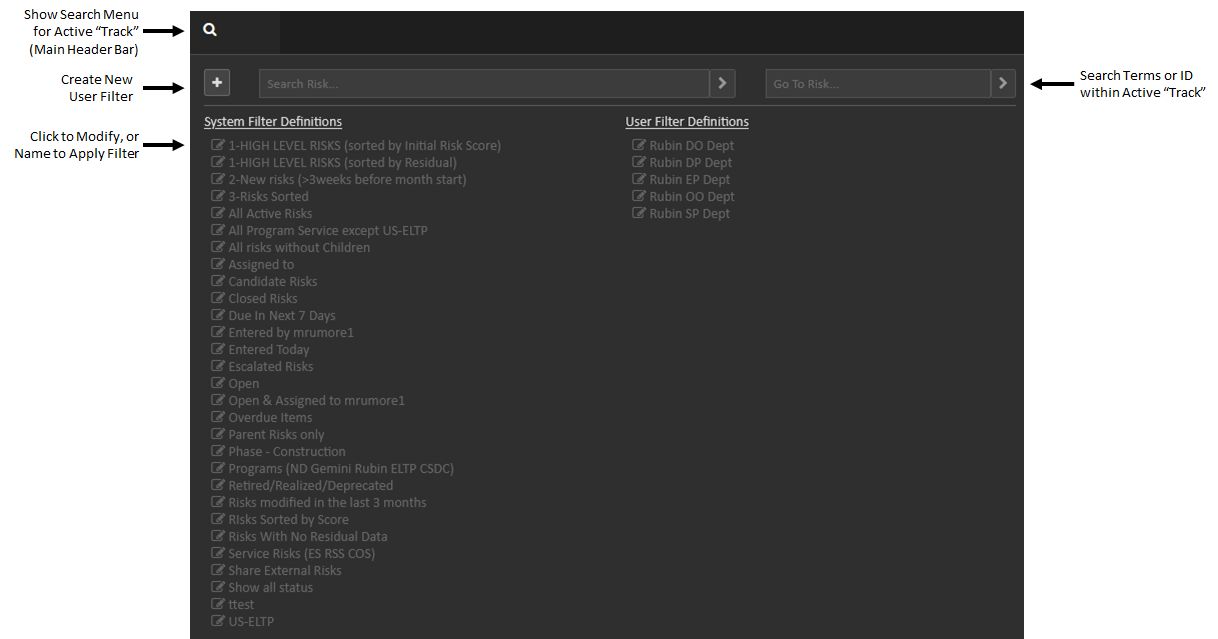
Figure 9 Description of filter selection menu.
Follow these steps to create a filter for risks assigned to a specific department:
Ensure you’re on the Risk Track by ensuring “Risks” is displayed in the upper-left of the main header bar.
Click the magnifying glass button in the main header bar, then click the plus (
+) button to start creating a user filter.Note
The
Sections/Tabsare defined by the collapsible sections within a risk/response/action, and theFieldsare entry fields under the respective section.
Set
Sections/TabstoAll Fields, andFieldstoRisk Department.A new section should appear on the page with the available filter criteria for this field — in this case, a list of the departments.
Note
You can hold the SHIFT, CTRL or ⌘ when clicking to select more than one criteria.
Select the department(s) for the filter criteria by clicking it so it is highlighted.
After selecting the filter criteria, the
Filter Definitionsection will update with the selection.Name the filter appropriately in
Filter Namefield, then clickSave and RunorRun (No Save)to apply the filter.If saved, this filter will be available under the
User Filter Definitionsin the Filter menu of the main header bar.
Reports
Reports are generated lists, summaries, matrices and charts to capture a snapshot or trending information of sorted and/or filtered items within a track. Reports can be used on demand, in scheduled events such as daily emails, or as dashboard components, and report data can be exported in a variety of forms.
The Report menu is similar to Figure 9, except the “Go to…” search is replaced by the chart creation menu button.
Follow these steps to create a Quick Report (i.e., a list) of active risks sorted by Risk ID:
Ensure you’re on the Risk Track by ensuring “Risks” is displayed in the upper-left of the main header bar.
Click the Reports button in the main header bar, then click the plus (
+) button to start creating a user report.Note
Each collapsible section under
Report Type(e.g., Quick Report, Trend Report) are different types of reports.
Expand the
Quick Reportsection underReport Type.Note
The default filter typically excludes items which are not in an Active status.
If items under another status are needed in a report, save a filter capturing the criteria, then select the filter in this drop-down menu. For example, using a filter with all statuses as a filter criteria will generate a report with all items.
If needed, set a filter via
Use Filterfield.Note
Each type of report includes different options.
If needed, set the report’s options available under the respective report type — in this case, set the first
Sort Byfield toRisk ID.Note
You can hold the SHIFT, CTRL or ⌘ when clicking to select more than one criteria.
Under the
Column Preferencestab, use theSelected ColumnsandAdd Column Fieldsections to add, remove, and reorder columns for the generated report.If needed, use the other tabs to arrange the report as you desire.
Name the report appropriately in
Report Namefield, then clickSave and RunorRun (No Save)to generate the report.If saved, you can generate a new report with the most current information in the database by clicking the report name under the
User Report Definitionsin the Reports menu of the main header bar.